Tablet Material
|
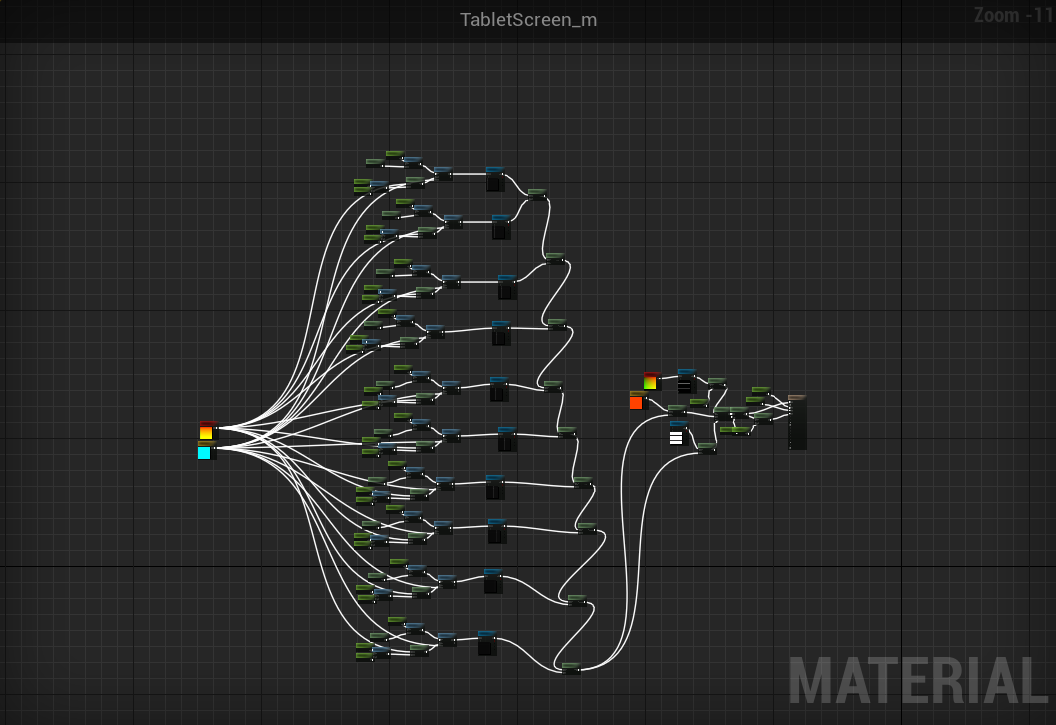
Our sensor audio output was to be visualized on a tablet screen. For this, I’d need spectrometer data from the audio files that were playing, but before getting a hold of that, I needed some way of visualizing the data. At the time I had not yet worked much with Unreal Engine’s material graph. I have written shaders in both HLSL (high-level shading language) and GLSL (OpenGL Shading Language) so I had a vague idea of what I was getting myself in to. I could, however, not figure out how to use collections or arrays properly, nor did I know about material functions, so I ended up with a lot of repeated nodes that could otherwise be avoided.
This material works by taking a material parameter collection that holds 10 different scalar values. These scalar values are used to scale the y-axis of the ten bars that go across the screen. Achieving this proved much harder than expected. The major issue that showed up was that textures could either be wrapped (i.e when scaled down they repeat) or clamped. When clamped, which I needed it to be, the area outside the scaled texture would be a stretched border. To get around this, I simply made the border black. This introduced some artifacts when scaling the bars, but instead of reworking the entire solution (which in hindsight could have been done much better) I decided to just try to hide it. |